Data becomes more and more important as our world becomes more and more digital. But reading data in its original style, rows and columns, makes you go crazy, at least if it is a big set of data.
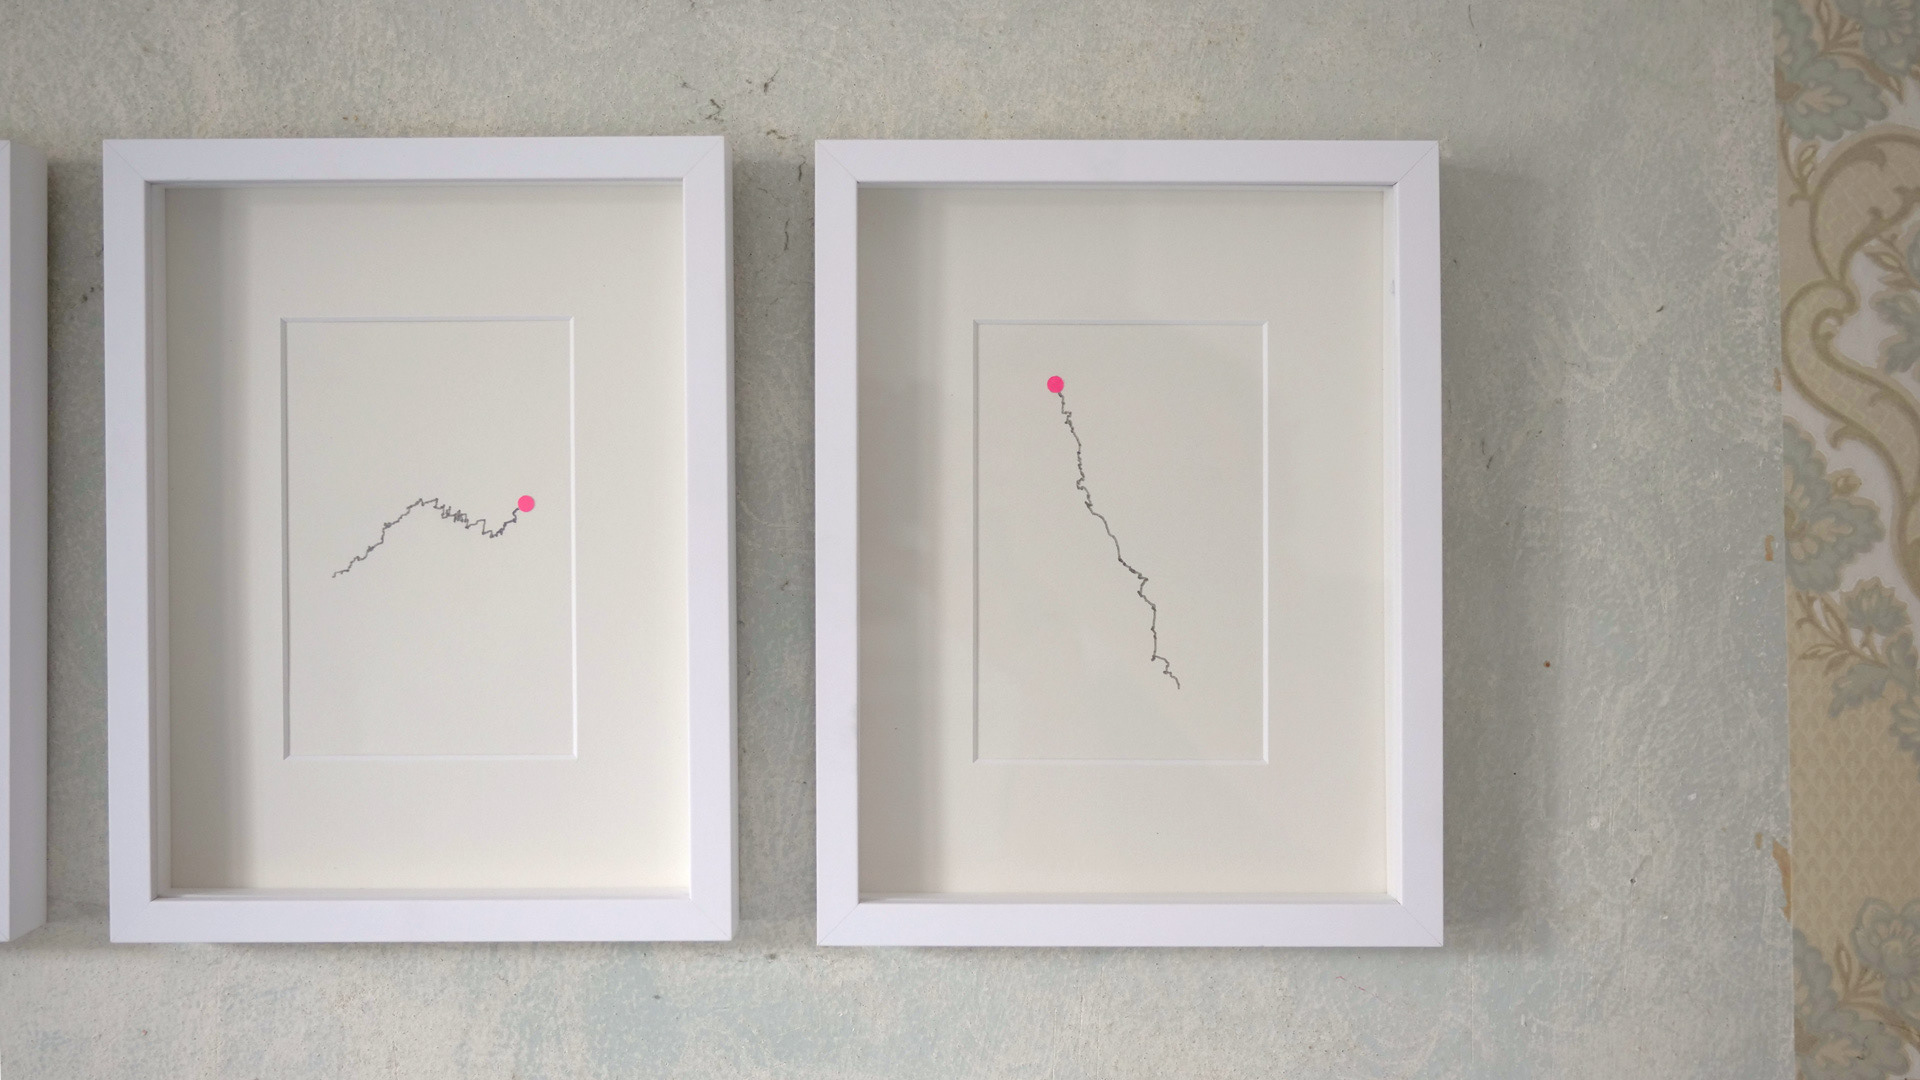
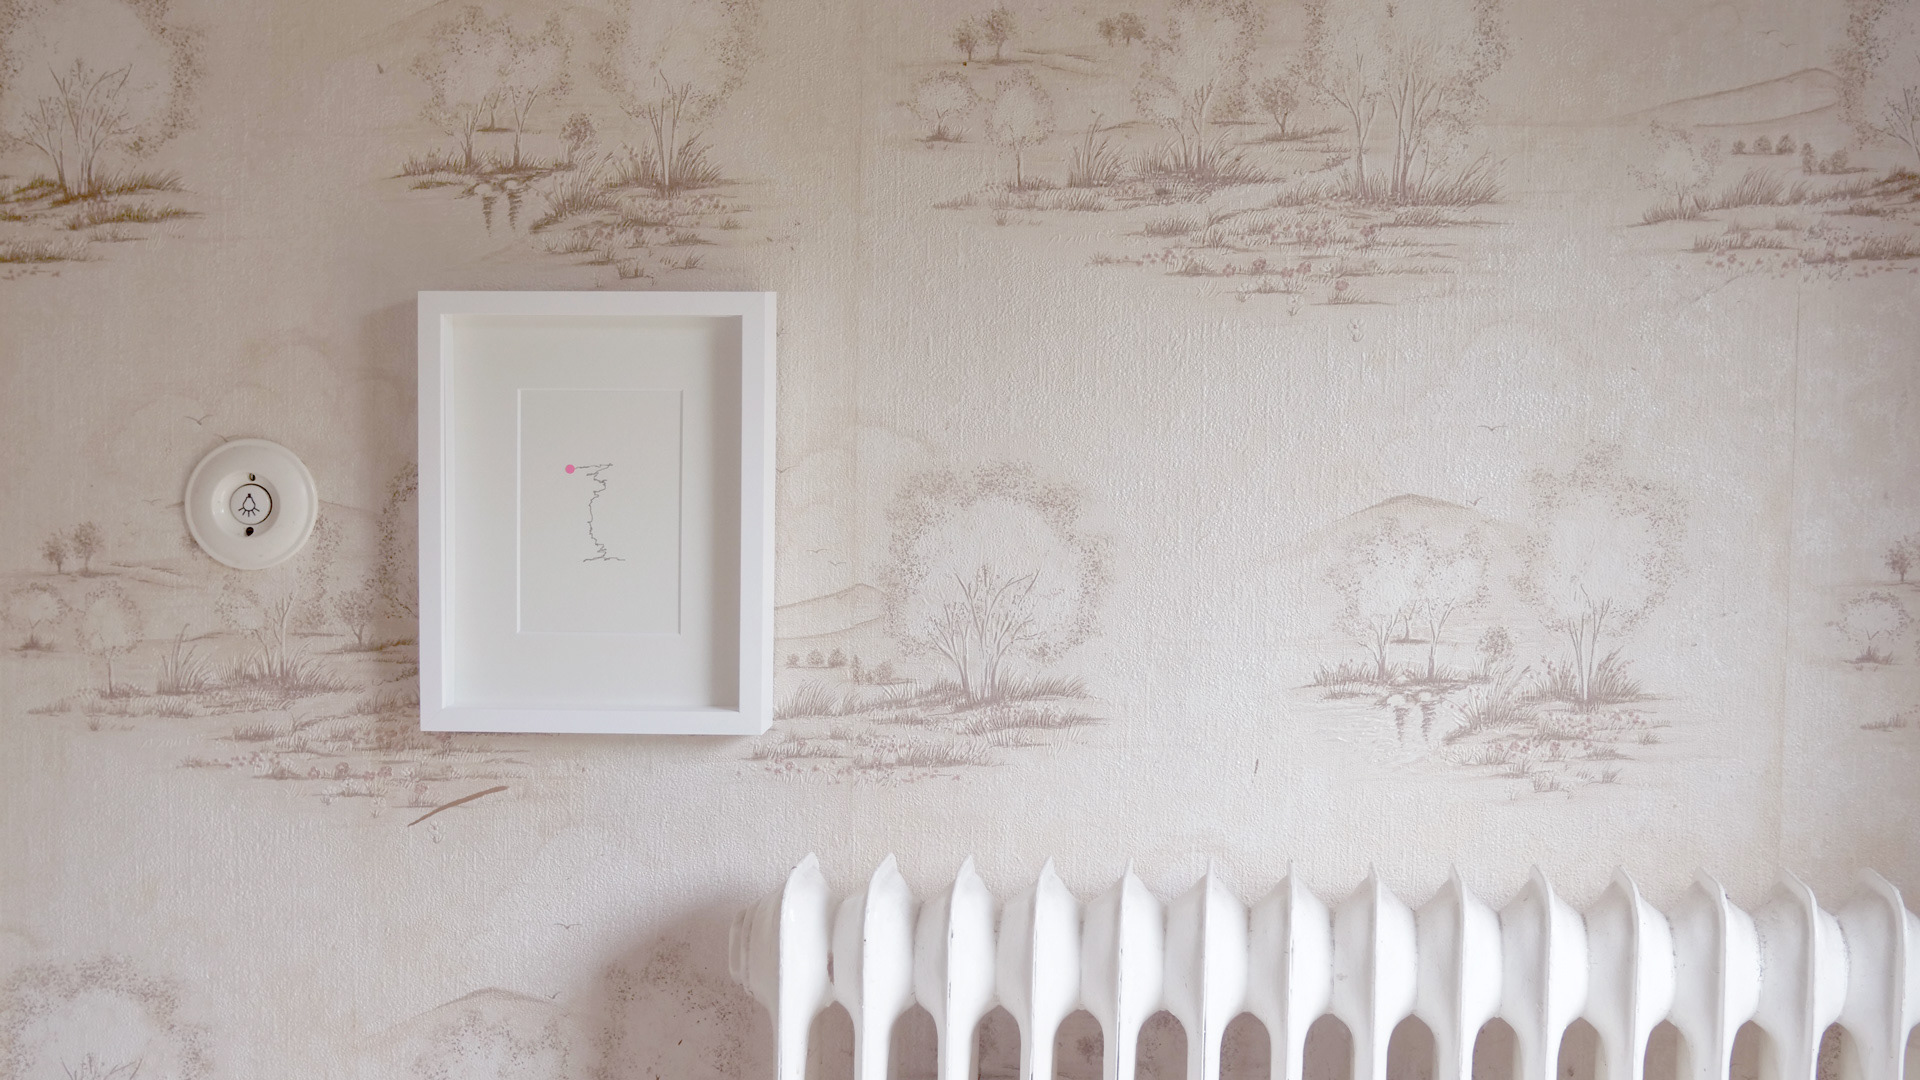
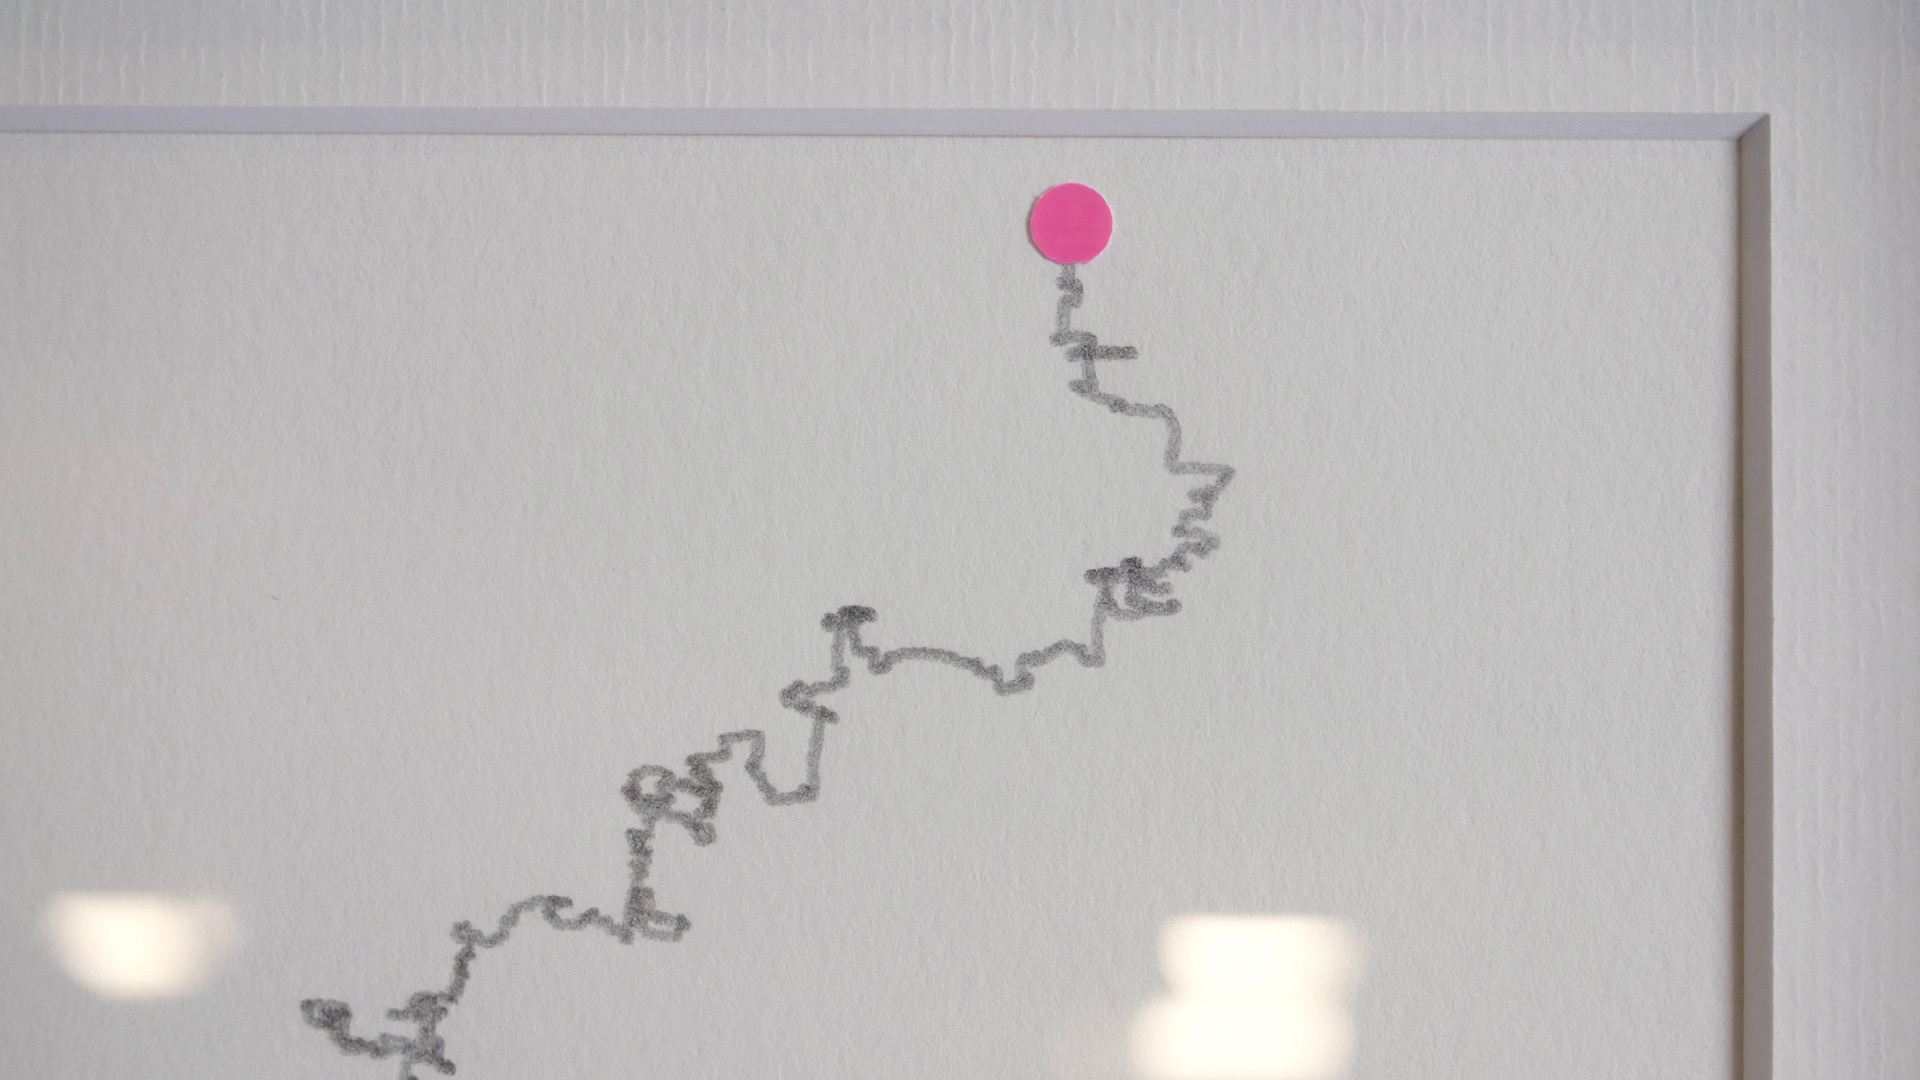
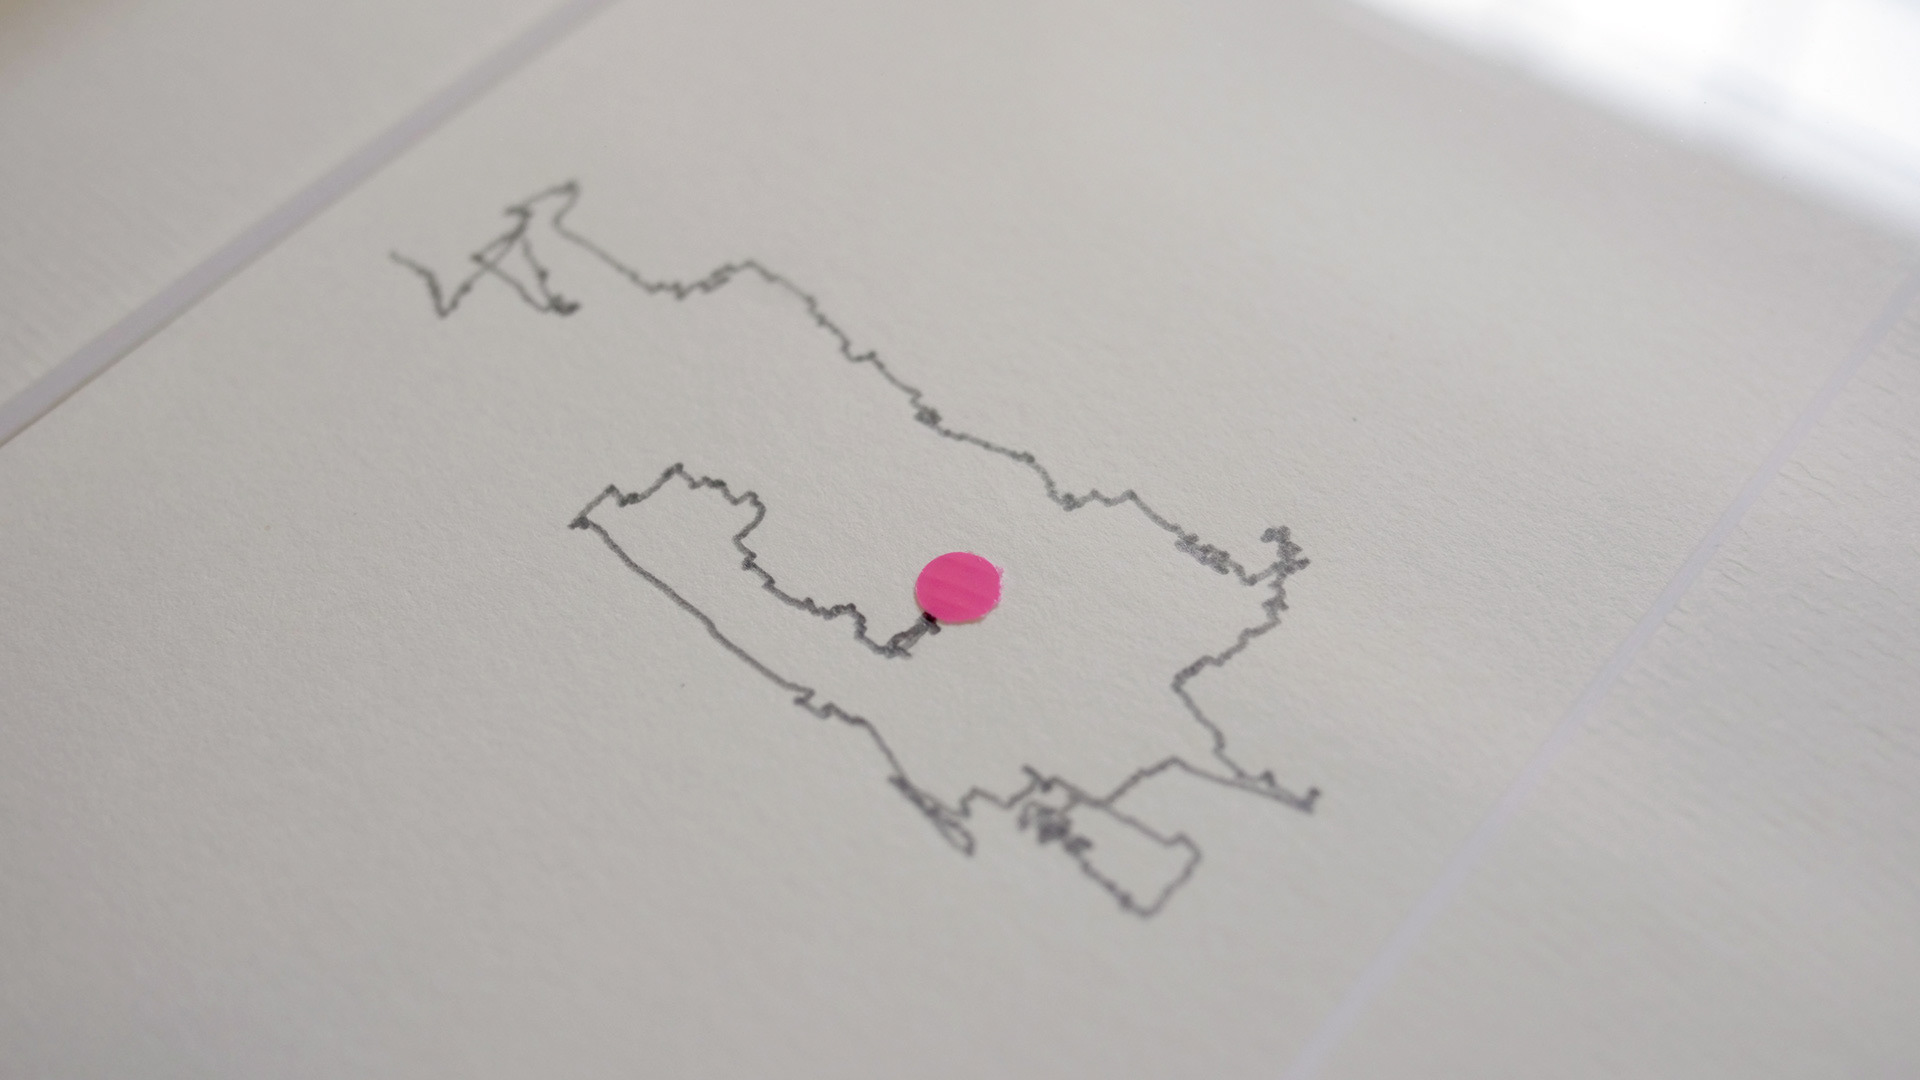
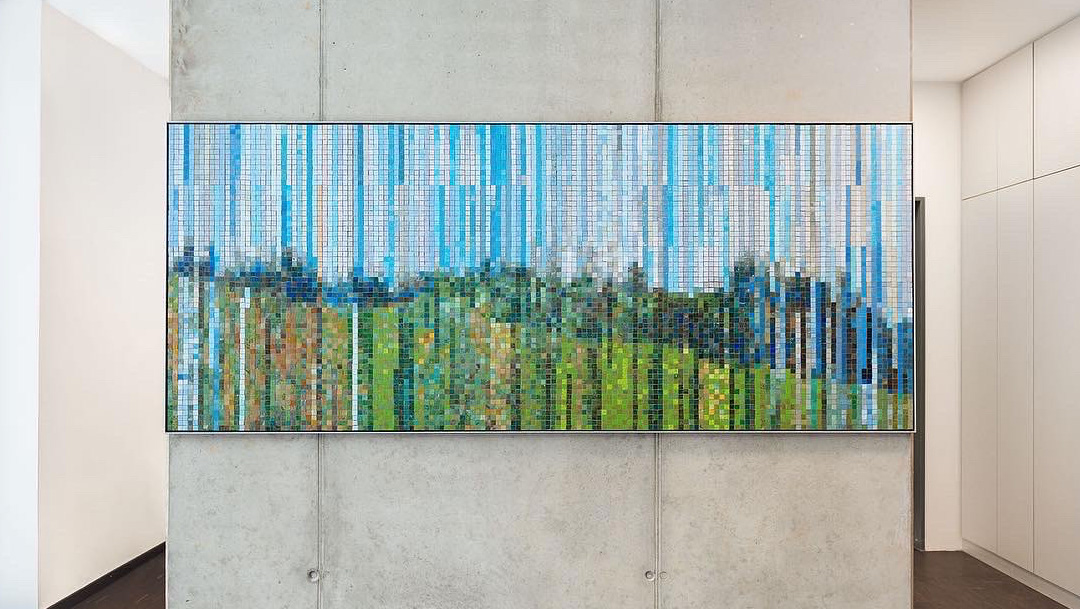
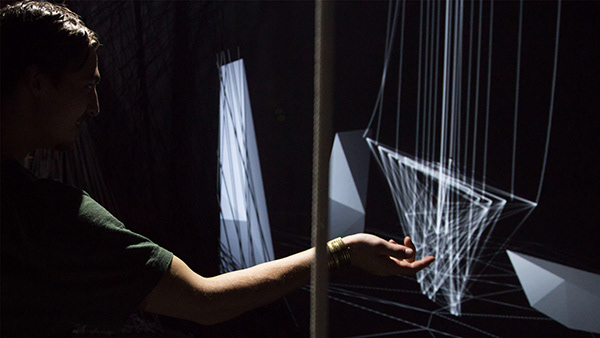
»Ballooning« visualizes one years wind data of our hometown Augsburg and its partner cities Inverness, Nagahama, Amagasaki, Dayton, Bourges, Liberec and Jinan. The idea behind the code that creates the traces is a helium balloon that gets released on January the 1st and flies until Dezember the 31rd.
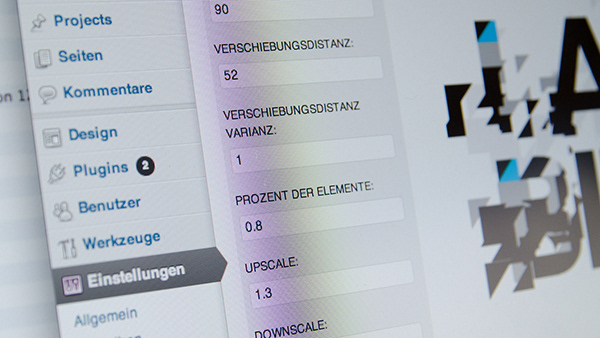
We wrote the code to introduce our students at the University of Applied Sciences, Faculty of Design, second semester Interactive Media, into the field of data visualization with Processing.
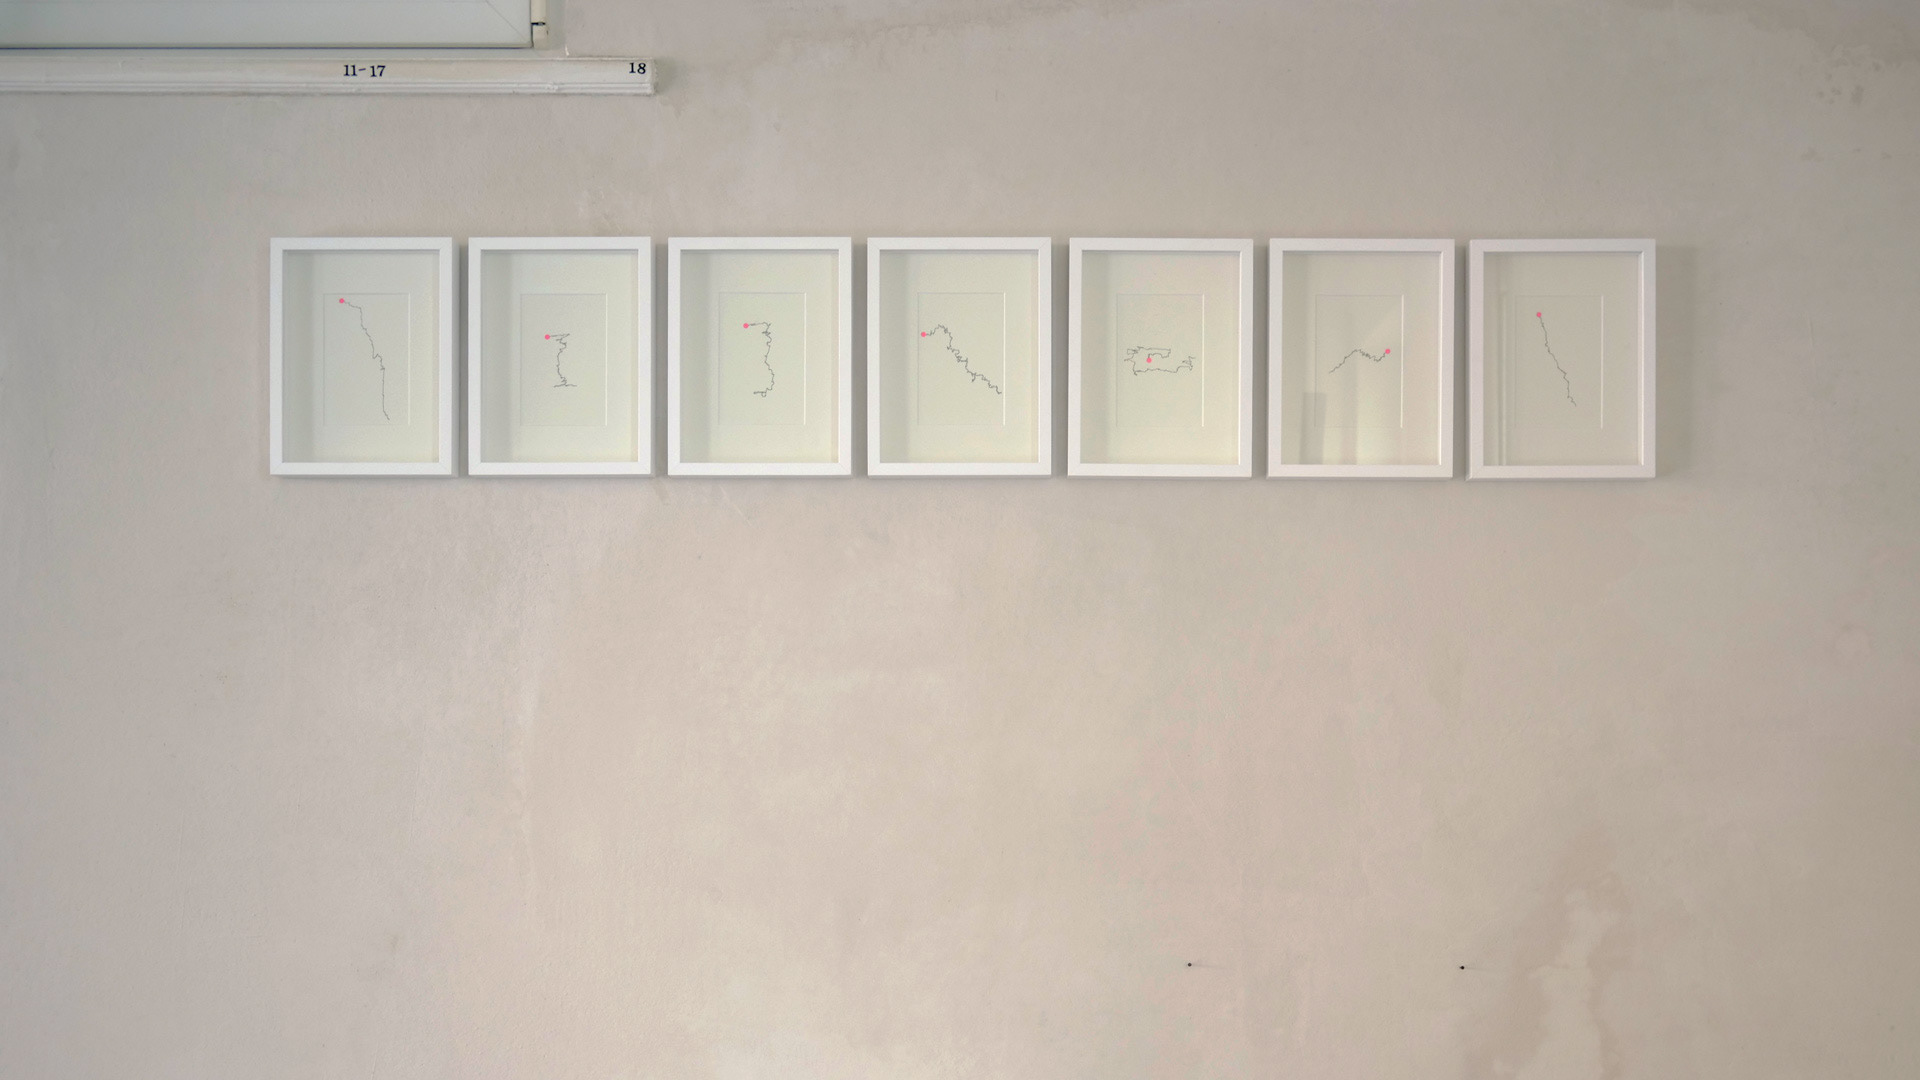
Afterwards we pushed the code to our CNC router to get it drawn on paper. We like the fact that they look like hand drawn on the first sight but you will realize that they are not if you watch closer.